Pulse Market Insight #179 OCT 26 2018 | Producers | Pulse Market Insights
Are Dry Bean Markets Getting Interesting?
In our last Pulse Market Insight, we try to show that it’s not doom and gloom for all pulses; faba bean prices have been spiking on short supplies in nearly all key exporters. Markets for other dry beans have largely been flying under the radar, but there are some early signs of life there as well.
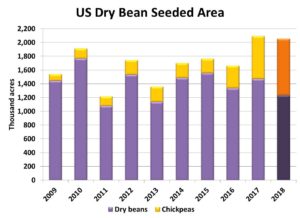
One of the biggest influences on Canadian dry bean prices is the situation just across the border in the US. The latest production estimate from the USDA is projecting a 6% increase in the 2018 dry bean crop, but there’s a bit of a glitch in the numbers. The USDA lumps together garbanzo beans (chickpeas) with its total for dry bean production and that has “skewed” the numbers.
If we strip out the chickpeas from the USDA’s number, the rest of the 2018 US dry bean crop will actually be smaller than last year. Yields for specific bean types haven’t been reported yet but our best guess is that the non-chickpea bean crop could be down by as much as 12% from last year.

That’s all well and good, but farmers don’t just plant beans; they plant individual classes of beans which can have distinct outlooks. Besides the overall acreage decline, US 2018 seeded area has changed very differently for the various classes. For example, 14,000 acres of cranberry beans were planted in the US this spring, more than double the 5-year average. Small red and small white bean acres were also up by more than 10% from the 5-year average.
On the other hand, US acreage of great northern and navy beans are down 22% and 12% from the 5-year average respectively. Other sizable declines were seen in pinto bean acreage (down 19% from the 5-year average) and light red kidneys (down 17%).
While that’s happening in the US, StatsCan is pointing to a larger 2018 dry bean crop in Canada. That said, there are some disagreements between the StatsCan and provincial crop insurance acreage numbers. But if we stick with the StatsCan data for now, seeded area is expected to top 350,000 acres, up 3% from last year and the most since 2007. Using the crop insurance acreage numbers to get at the individual bean types, we see larger increases for black (up 21%), small red (up 27%) and great northern (up 14%) beans compared to last year. Pinto bean acreage is down 2% from last year and there are 20% fewer navy bean acres.
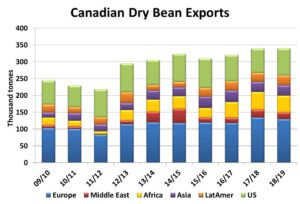
StatsCan is also very optimistic (maybe overly) in forecasting a record dry bean yield of 2,230 pounds per acre, which would mean a 2018 dry bean crop of 345,000 tonnes. That’s not really a concern though as Canadian exports have been trending higher the last couple of years and demand is expected to be firm again in 2018/19.

One reason for the strong export outlook is the boost in demand for Canadian beans as a result of EU tariffs on US dry beans. This largely affects white beans, especially navies, and that’s caused those bids to firm up, especially with fewer 2018 acres of navies.
Demand from south of the border should also pick up. The export chart also shows that the US is the largest single buyer of Canadian dry beans and if its 2018 bean crop is actually smaller by 10% or more, it will mean increased US purchases of Canadian beans.
All these factors should contribute to a strong North American dry bean market in 2018/19. Price behaviour for individual classes will vary but all should see firm to higher prices as the marketing year progresses, another bright spot in pulse markets.
Pulse Market Insight provides market commentary from Chuck Penner of LeftField Commodity Research to help with pulse marketing decisions.
