

What Do StatsCan Pulse Stocks Numbers Reveal?
There’s been a flurry of crop data coming out of StatsCan recently, with more on the way in a few days. Normally, I like to give StatsCan the benefit of the doubt but lately, that’s been harder to justify. There are even more questions than usual this time around. Most of the concerns come from changes to StatsCan’s processes which add a lot more uncertainty to its estimates.
On August 31, StatsCan issued its first 2020 yield and production estimates. In the past, those have been based on phoning and emailing farmers but apparently the Covid crisis pre-empted the surveys. Instead, computer models using satellite vegetation images taken at the end of July were the basis of the yield estimates. Even if you’re a believer in the computer models, month-old data isn’t very useful, especially since crops experienced deteriorating conditions throughout August.
Fortunately, StatsCan will be updating its yield estimates in a few days based on satellite images from the end of August. That should provide a little more clarity about yields, although questions remain about the accuracy of computer models.
The other key piece of information StatsCan issues at this time of year is July 31 stocks, which give a benchmark of crop inventories that will be carried forward into the next marketing year. This information is usually gathered when StatsCan surveys farmers about crop yields in July but as we stated, that survey didn’t happen this year.
According to StatsCan, data for on-farm stocks was collected between May 14 and June 11, back when farmers were asked about their 2020 acreage. StatsCan made adjustments after the fact, but the 6-10 week delay makes the July 31 stocks numbers very questionable and, in some cases, clearly wrong. In any case, these estimates are worth discussing, at least as a starting point.
For peas, StatsCan estimated July 31 stocks at 233,000 tonnes, down from 312,000 the year before and little more on the “snug” side compared to the last few years. This estimate seems fairly reasonable, given the firm price behaviour late in 2019/20. Although StatsCan doesn’t provide a breakdown by type, it’s clear that green pea stocks were much tighter than yellows. These low carryover supplies also means the bigger 2020 crop won’t weigh quite as heavily on the market.
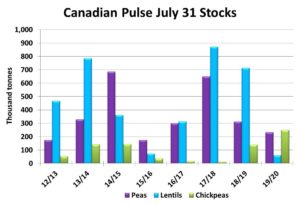
When it comes to lentils, StatsCan showed July 31 inventories of only 61,000 tonnes. Based on firmer prices late in 2019/20, it’s clear lentil supplies had shrunk considerably, but this number is unrealistically low. Commercial inventories (a solid number) alone were 58,000 tonnes at the end of July, which would mean all farmers across western Canada were holding only a total of 3,000 tonnes. And even to come up with this small amount, StatsCan had to go back and make adjustments for the last two years to add supplies. Although StatsCan number is clearly wrong, the bottom line though is that lentil carryover supplies are tight which will help offset the big increase in the 2020 crop.
Chickpeas are the exception among pulses, and not in a good way. StatsCan pegged July 31 stocks at 250,000 tonnes, the highest on record. While it’s possible that in this case, StatsCan overestimated stocks, the weak price performance for chickpeas in 2019/20 confirms supplies are burdensome. If this StatsCan number is close to reliable, these carryover supplies will be enough to offset the smaller 2020 crop and continue to weigh on prices.
Pulse Market Insight provides market commentary from Chuck Penner of LeftField Commodity Research to help with pulse marketing decisions.