
Response To Increasing Phosphorous Fertilizer Rates
The overall intent of the Alberta Pulse Growers – Plot2Field (P2F) initiative is to transfer small plot research to a field scale basis and assess the quality of data obtained. The P2F research described in this article was designed to test the following research questions:
Three rates of phosphorous fertilizer, applied as MAP, were tested in a randomized complete block design with three replicates: 0 lbs actual P2O5/acre, 15 lbs actual P2O5/acre, and 30 lbs actual P2O5/acre. These three phosphorous fertilizer rates were applied in combination with pea seed that had been treated with an insecticide seed treatment, Cruiser Maxx (Thiamethoxam) to help manage pea leaf weevil (PLW). A fourth treatment was added, to compare the PLW insecticide seed treatment with no insecticide seed treatment at the 15 lbs actual P2O5/acre rate. The yellow pea variety, CDC Meadow, was seeded to reach a target plant stand of 8 plants/ft2.
The P2F trial was conducted in 2019 and 2020 at multiple sites across Alberta. There were 22 site-years of data collected and all trial cooperators used a seed drill with a 10” row spacing. However, one site-year was removed from the overall analysis due to the omission of the no insecticide seed treatment which created an unbalanced dataset. This resulted in 21 site-years of data for multi-year analysis.
Multi-year and individual site year analysis was conducted using SAS 9.4, SAS Institute Inc., Cary, NC. For all measured variables, the analysis of variance (ANOVA) indicated there were significant differences between sites. The ANOVA also tested for significant phosphorous fertilizer rates / insecticide treatment effects and site-year x treatment interactions. The LSmeans are reported. Where there were significant treatment differences, a Tukey mean separation was used to determine differences between treatments.
The average yield of all trials was 44 bu/acre; however, yields ranged from a low of 14.5 bu/ac at Vulcan Site #2 in 2019 to a high of 71.1 bu/ac at Kneehill County Site #1 in 2020.
There was a significant yield response to increasing phosphorous fertilizer rates found in the multi-year analysis (Figure 1). Averaged over all site-years, there was a 2 bu/ac yield increase as MAP rates increased from 0 to 30 lbs actual P2O5/acre. However, there was no significant yield difference between the 15 lbs actual P2O5/acre and the 30 lbs actual P2O5/acre rates, suggesting that the application of 15 lbs actual P2O5/acre is adequate to maximize yield.
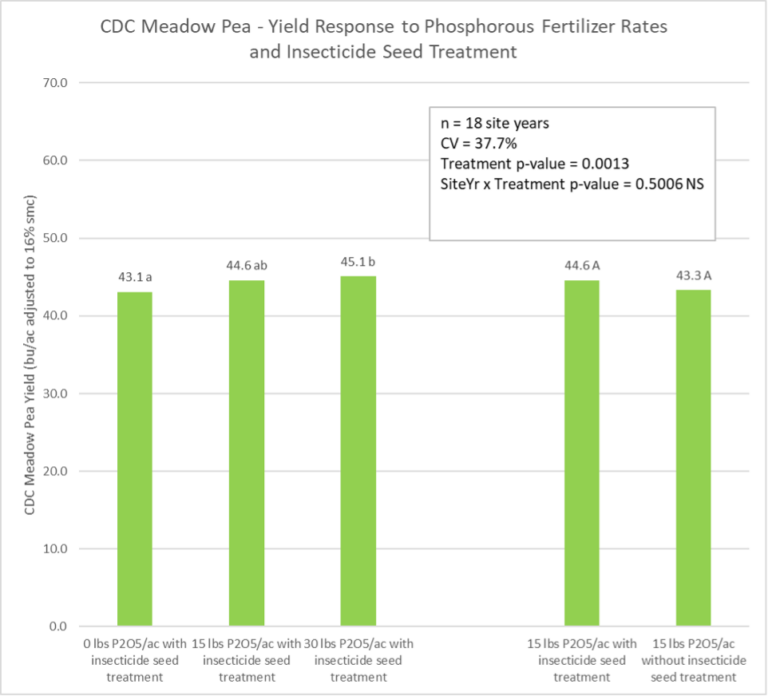
Figure 1. Yield response of CDC Meadow yellow field pea to increasing phosphorous fertilizer rates and the 15 lbs actual P2O5/acre rate with or without and insecticide seed treatment. Note: there were only four treatments in this experiment, but the 15 lbs actual P2O5/acre with insecticide seed treatment is displayed twice for visual comparisons.
Many individual sites did not show significant yield responses to the increasing MAP rates. However, this can be attributed to the lack of precision in all field scale research. The benefit of the Plot2Farm trials is the large number of site-years. With 18 site-years of yield data, the lack of precision of individual trials can be overcome in the compiled analysis of all site-years. The yield data trends were supported by the number of pods per plant data (Table 2) which also showed a significant increase in pods at the higher MAP rates in the overall analysis.
Given the range of spring soil test phosphorous levels, it was important to analyze individual site-years to determine which sites have a higher likelihood of a significant yield response. Individual site-year analysis showed significant yield increases at five of 18 site-years. Sites that were considered to have deficient or marginal spring soil test phosphorous levels (less than 30 ppm in the top 0-6” depth), showed a yield response to increasing MAP rates 45% of the time (Table 1). Sites that were considered to have optimal spring soil test phosphorous levels (more than 30 ppm in the top 0-6” depth) had a yield response to increasing MAP rates only 12.5% of the time.
As expected, sites with lower spring soil test phosphorous levels (less than 30 ppm at the 0-6” depth) are more likely to show a yield response to increasing rates of MAP fertilizer. However, a significant yield response is not guaranteed, even on soils with low spring soil test phosphorous levels. Table 1. Frequency of a significant yield response based on spring soil test phosphorous levels.
| Soil Test Phosphorous Levels | Range of spring soil test phosphorous levels (0-6”) | Number of Sites | Percent of Sites with a Significant Yield Response |
|---|---|---|---|
| Deficient to Marginal | 10 - 29 ppm | 11 | 45% |
| Optimum | 30 - 80+ ppm | 8 | 12.5% |
There was no statistically significant yield response to the insecticide seed treatment compared with no seed treatment (Figure 1). The 2019 pea leaf weevil (PLW) surveys found very low levels of PLW damage at all sites where yield data was collected. The majority of sites had no visible feeding damage with less than two feeding notches, on average. This explains the lack of response to the insecticide seed treatment.
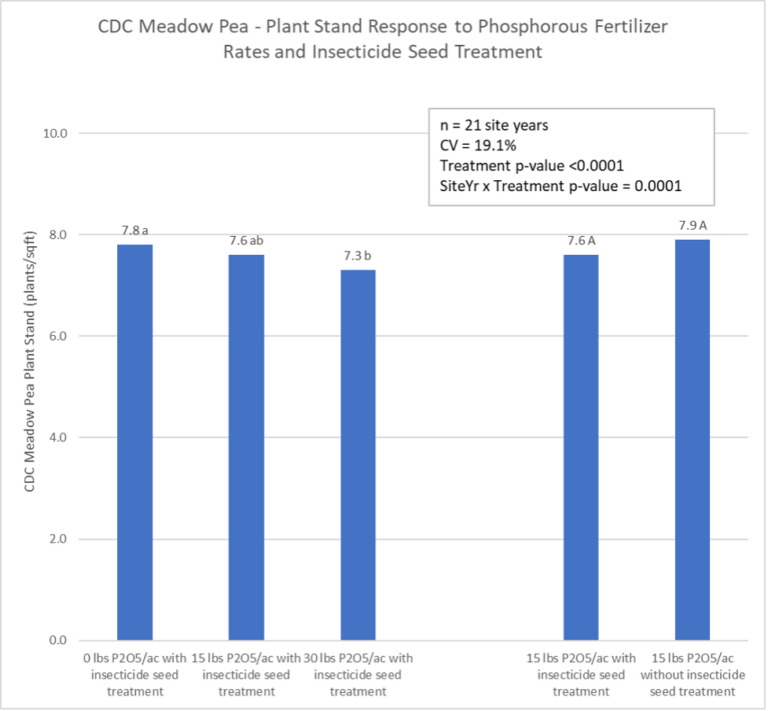
The average plant stand was 7.7 plants/ft2, which is 96% of the target plant stand; however, the plant stand at MacKenzie County in 2020 was only 5.2 plants/ft2or 65% of the target, while the highest plant stand was at Kneehill County Site #1 in 2019 with 10.7 plants/ft2or 134% of the target.
High rates of seed placed phosphorous can potentially result in lower plant stands. In agreement with this, the multi-year analysis also showed a significant decrease in plant stand as phosphorous fertilizer rates increased (Figure 2). Averaged overall site-years, there was a 0.5 plant/ft2 decrease as MAP rates increased from 0 to 30 lbs actual P2O5/acre. However, there was no significant yield difference between the 0 and 15 lbs actual P2O5/acre rates. Given that lack of difference, 15 lbs actual P2O5/acre is adequate to maximize yield while not damaging plant stands.
In general, individual sites did not show significant plant stand responses to increasing MAP rates. This was despite the significant statistical results observed in the multi-year analysis. Again, this can be attributed to the lack of precision in field scale research. However, since this P2F trial has 21 site-years of plant stand data, the lack of precision of individual trials is overcome in the multi-year analysis.
Due to the minimal PLW feeding damage, there was not a significant plant stand response to the insecticide seed treatment compared with no seed treatment (Figure 2).
Response to increasing phosphorous fertilizer rates
There was no significant response of nodule ratings, days to flower, or protein to increasing phosphorous fertilizer rates (Table 2). Pods per plant were significantly higher for both the 15 and 30 lbs actual P2O5/acre treatments (Table 2) which supports the yield data trends. Days to maturity were also shortest for the 15 and 30 lbs actual P2O5/acre treatments. Standability was best for the 0 and 15 lbs actual P2O5/acre treatments. Given these trends along with the plant stand and yield data, the 15 lbs actual P2O5/acre rate provides an ideal balance of yield and agronomic performance.
Response to insecticide seed treatment
Like the previously discussed variables, there was no significant difference in nodule rating, pods per plant, days to flower, days to maturity, lodging, or protein between the treated and untreated seed (Table 2). This is attributed to the lack or limited PLW pressure found in the study years.
Table 2. Multi-year analysis of nodule ratings, pods per plant, days to flowering, days to maturity, lodging, and protein response to increasing phosphorous fertilizer rates and insecticide seed treatments.
| Multi-Year Analysis | Nodule Rating (1 -13) |
Pods per Plant | Days to Flower (from Seeding) |
Days to Maturity (from seeding) |
Lodging (1-9) |
Protein (%) |
|---|---|---|---|---|---|---|
| Number of Sites | 21 | 18 | 21 | 21 | 21 | 20 |
| 0 lbs actual P2O5/acre + insecticide seed treatment | 10.7 a | 7.2 a | 55.1 a | 105.5 a | 4.86 a | 19.7 a |
| 15 lbs actual P2O5/acre + insecticide seed treatment | 11.0 a | 7.7 b | 54.8 a | 104.8 b | 4.95 ab | 19.9 a |
| 30 lbs actual P2O5/acre + insecticide seed treatment | 11.0 a | 7.6 a | 54.9 a | 104.9 ab | 5.03 b | 19.8 a |
| 15 lbs actual P2O5/acre no insecticide seed treatment | 11.2 A | 7.3 A | 54.5 A | 105.0 A | 4.95 A | 19.9 A |
| 15 lbs actual P2O5/acre + insecticide seed treatment | 11.0 A | 7.7 B | 54.8 A | 104.8 A | 4.90 A | 19.9 A |
| Average | 11.0 | 7.5 | 54.8 | 105.1 | 4.94 | 19.9 |
| CV% | 20.1 | 40.6 | 13.8 | 10.9 | 56.2 | 11.4 |
| p-value | 0.0064 (significant is attributed to the difference between the 0 +insecticide and the 15 –insecticide treatments) | 0.0022 Significant | 0.1259 NS |
0.0403 Significant |
0.0081 Significant |
0.2416 NS |
†NS = Non-Significant. Values followed by the different lower or uppercase letters are significantly different based on a Tukey mean separation test with a p = 0.05.
Note: there were only four treatments in this experiment, but the 15 lbs actual P2O5/acre with insecticide seed treatment is listed twice for visual comparisons.
These P2F results show the power of multiple site-years of data. Farm scale research is known to be less precise than small plot research when detecting statistical treatment differences. However, having this trial conducted at 22 site-years, allows for statistically meaningful comparisons to be made when analyzing the overall dataset. In designing future P2F research, it is highly recommended to have a large number of site-years to ensure that statistically meaningful trends can be detected in the multi-year analysis.
While increasing phosphorous fertilizer rates from 0 to 30 lbs actual P2O5/acre, increased yields by 2 bu/ac in the multi-year analysis, there was a much higher frequency (45% chance) of achieving a yield response when spring soil test phosphorous levels were less than 30 ppm in the top 0-6” depth. Given the lack of statistically significant yield response at individual site years, it is recommended to apply 15 lbs actual P2O5/acre as this gave a significantly higher yield than the 0 lbs actual P2O5/acre treatment, but a statistically similar yield as the 30 lbs actual P2O5/acre treatment.
While there may not be a consistent economic yield response to the 15 lbs actual P2O5/acre rate, there is a small reduction in days to maturity. There was no detrimental effect of the 15 lbs actual P2O5/acre vs the 0 lbs actual P2O5/acre rate for: plant stand, nodule rating, days to flower, lodging or protein. The annual application of MAP also helps to maintain long term soil fertility and prevents mining soil phosphorous reserves.
Based on the study results and the need to maintain long term soil phosphorous levels, it is recommended to apply 15 lbs actual P2O5/acre to field pea.
There was no benefit in response to the insecticide seed treatment due to the lack or very limited amount of pea leaf weevil presence. It is therefore recommended to only use an insecticide seed treatment where there is anticipated pea leaf weevil pressure.